Model Gallery

Six consumer data models in the Fader and Hardie tradition, fitted and run live in your browser on synthetic data. Each page opens with a business question, shows the model at work, and lands on the decision it feeds.

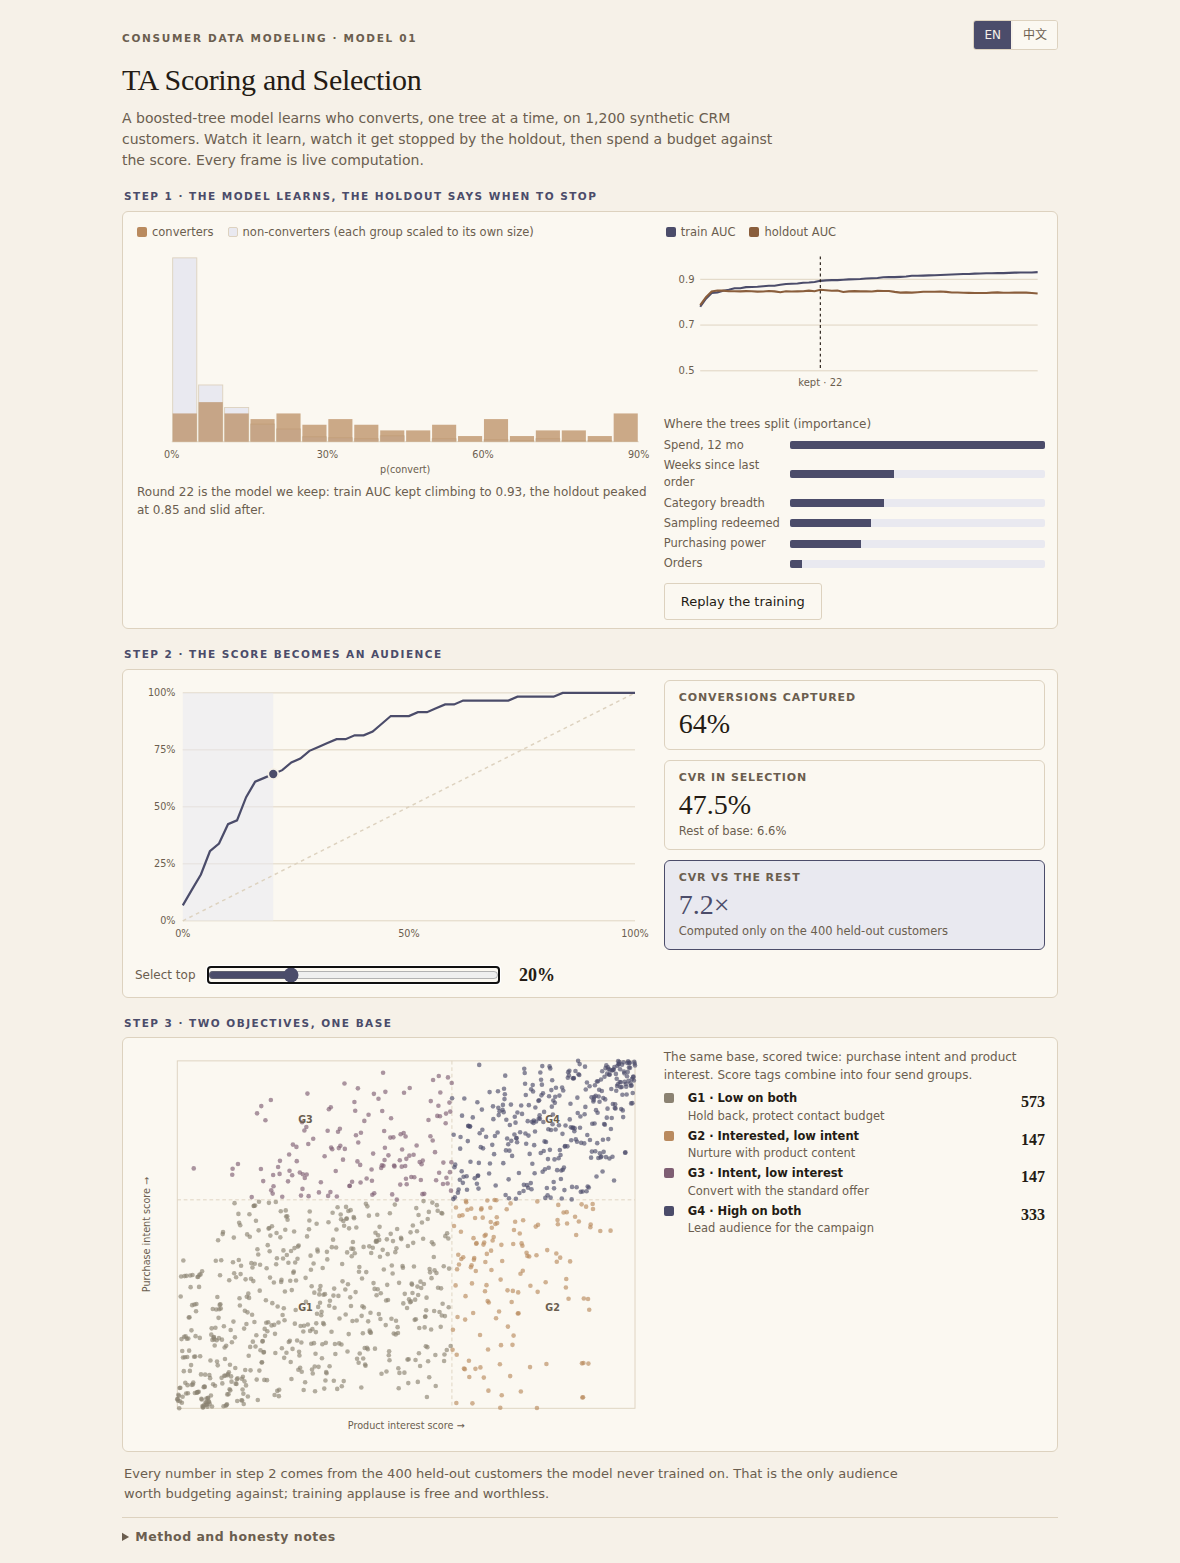
TA Scoring preview
TA Scoring

60 boosted trees learn who converts, and the holdout decides when to stop.

Interactive modelEN / 中文
Segmentation preview
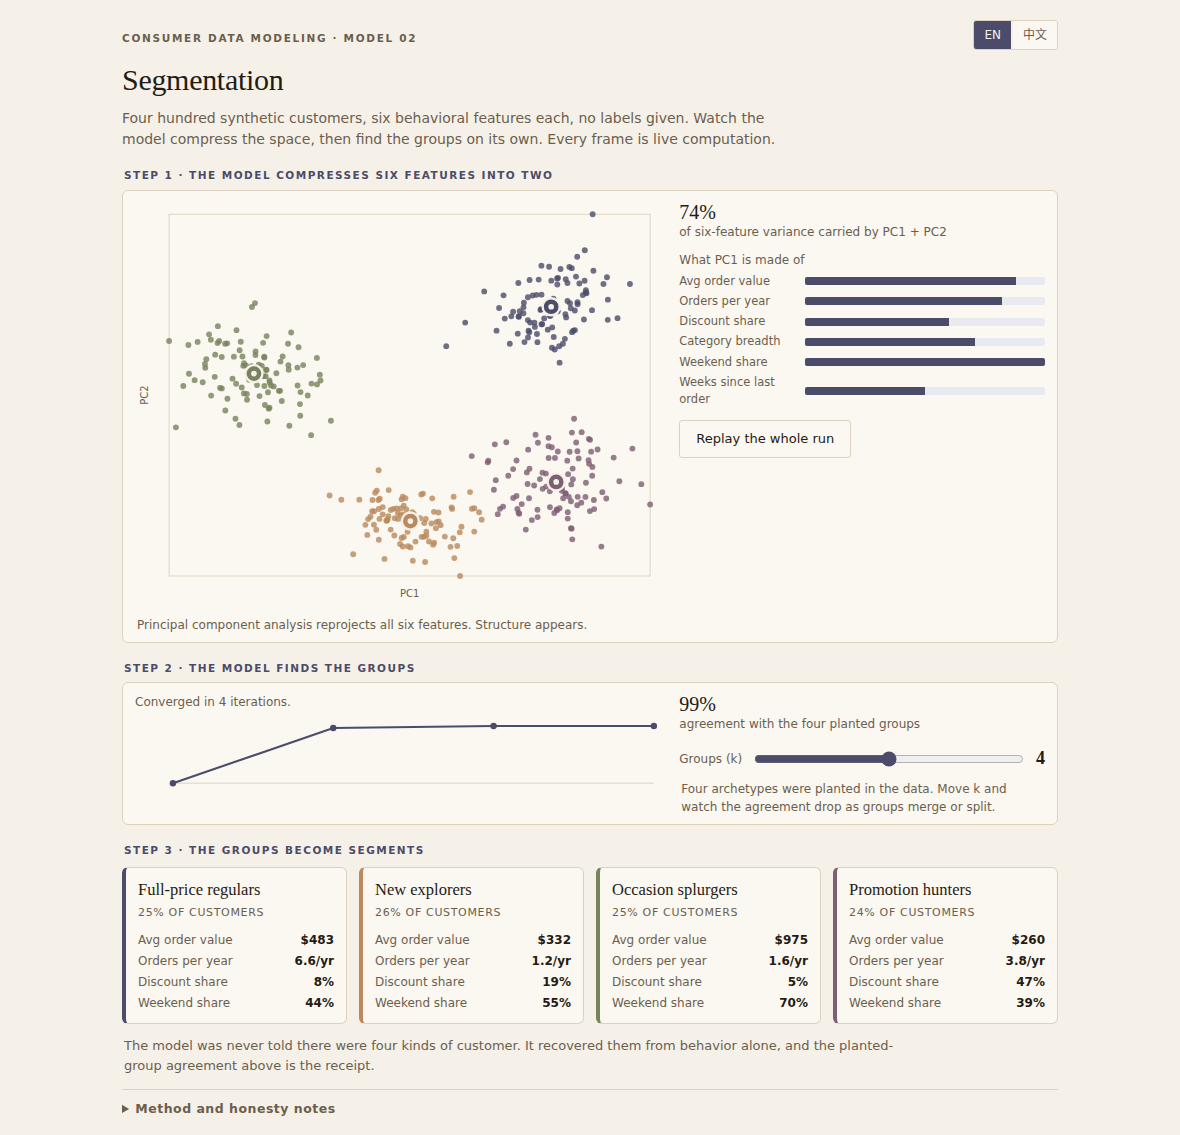
Segmentation

k-means finds four planted customer groups live, with the inertia curve to prove it.

Interactive modelEN / 中文
CLTV preview
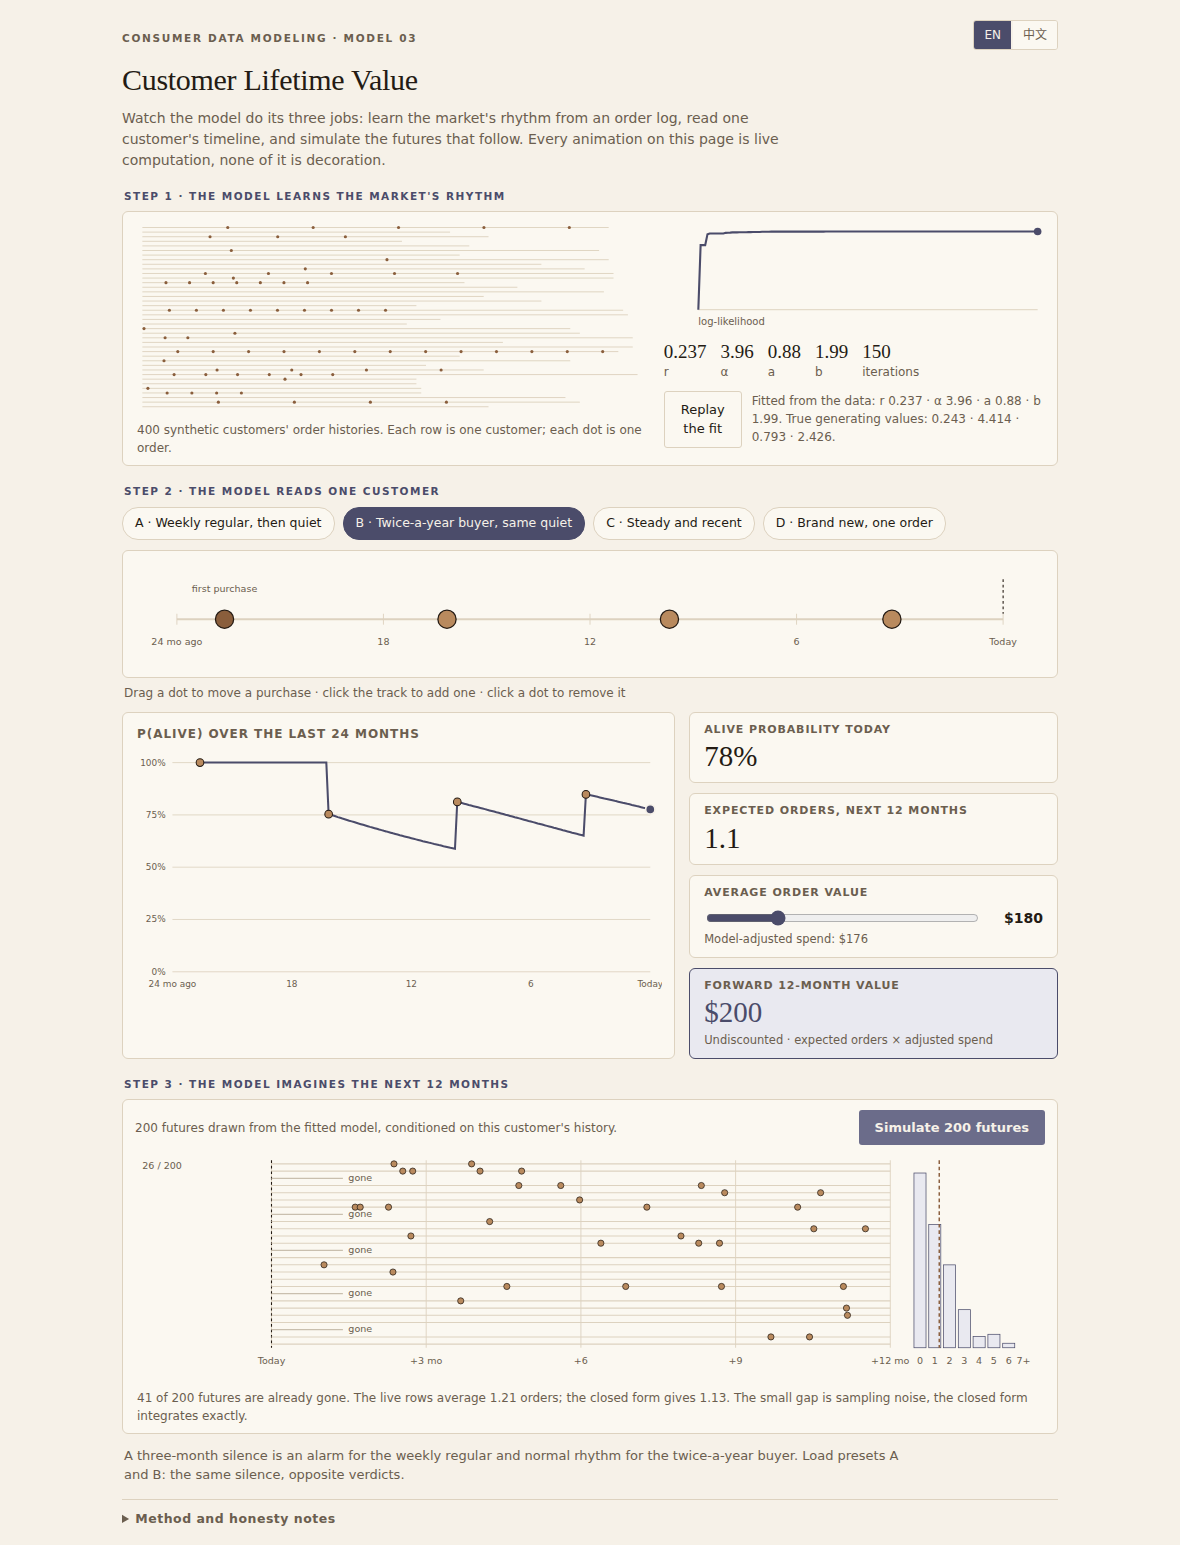
CLTV

A BG/NBD model fitted in the browser, then your edits to one customer's timeline replayed as 200 futures.

Interactive modelEN / 中文
Recommendation preview
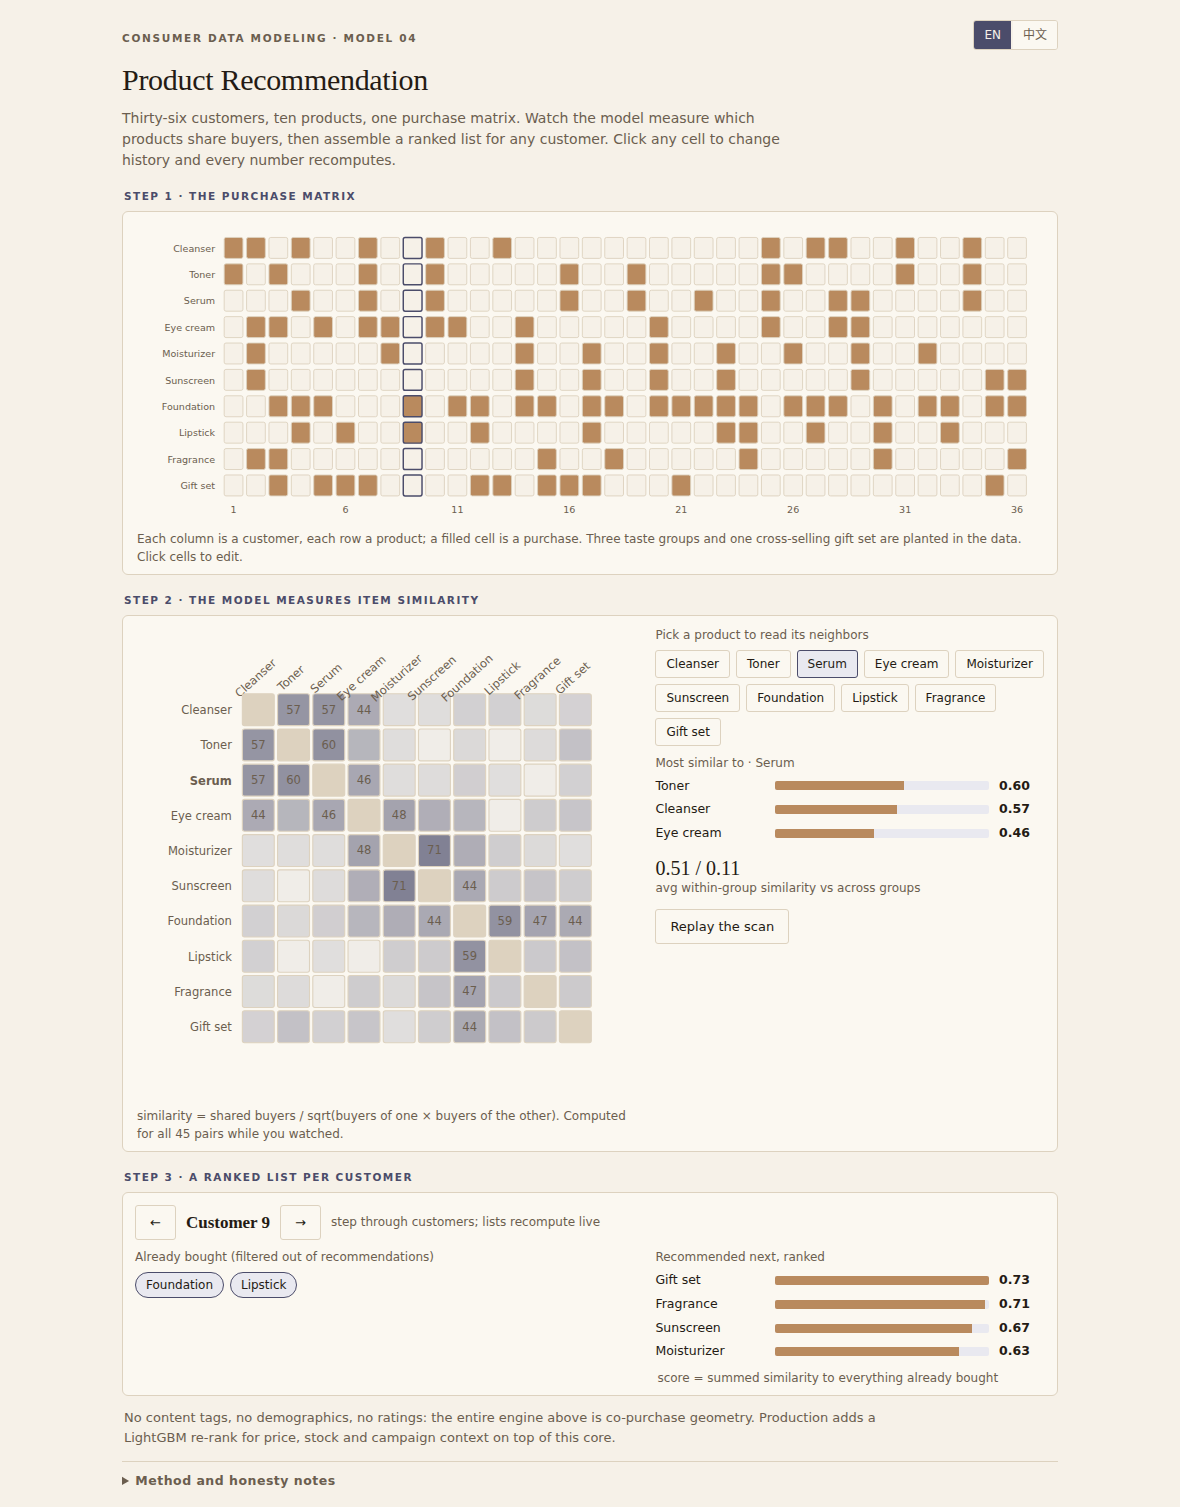
Recommendation

A purchase matrix measures its own item similarity, then ranks a list for any customer.

Interactive modelEN / 中文
Media Mix preview
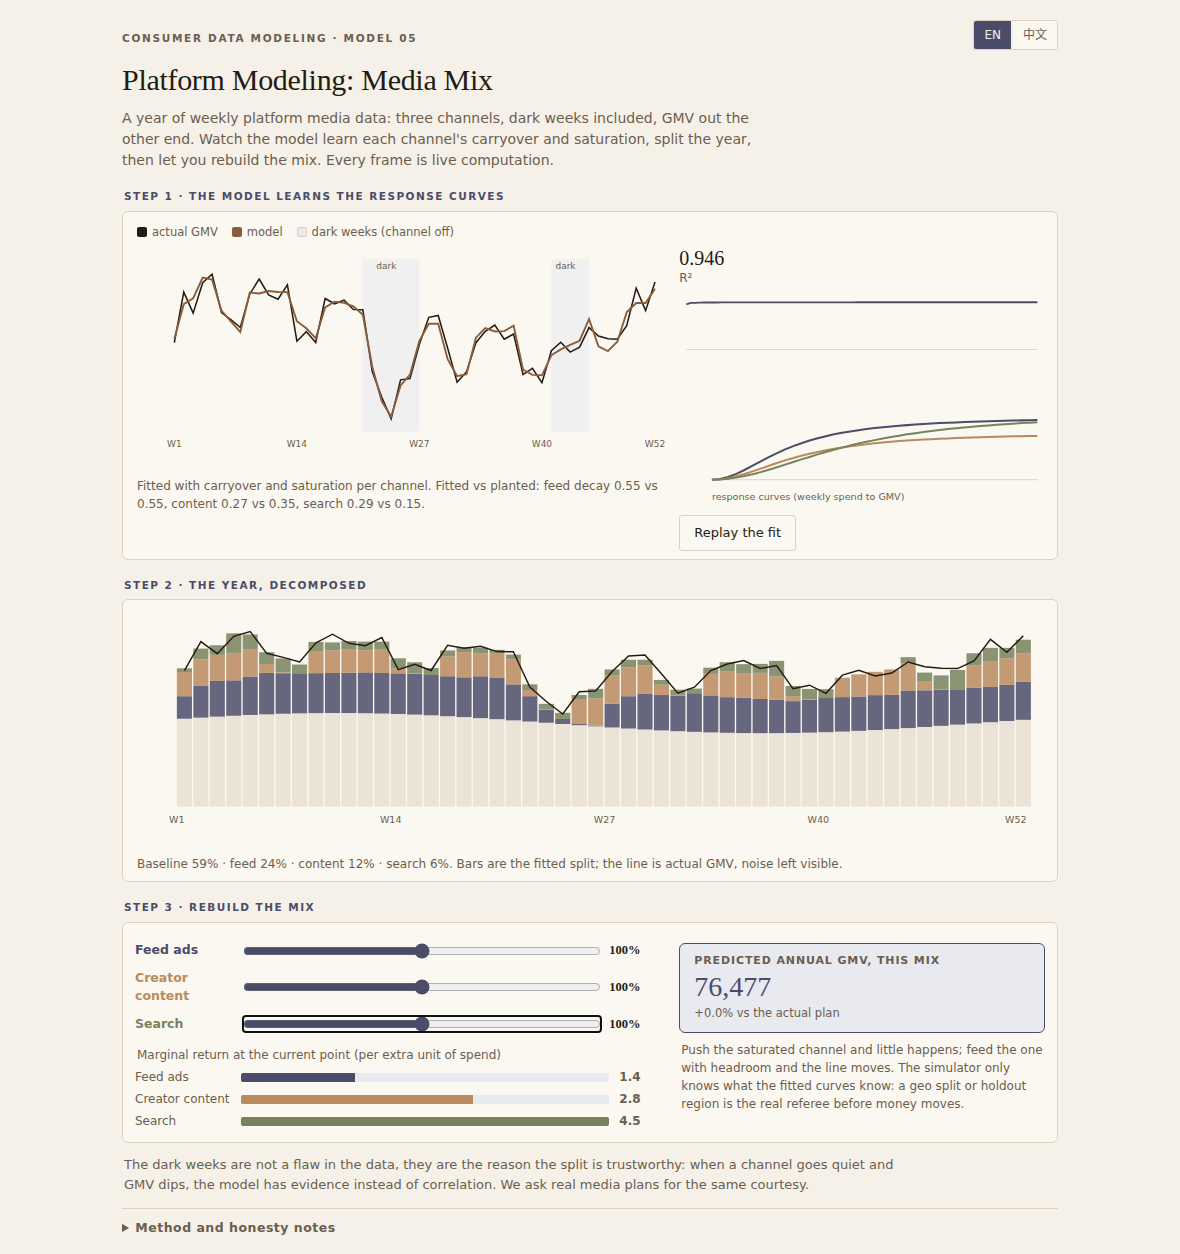
Media Mix

Response curves learned from a year with dark weeks, then the mix rebuilt on sliders.

Interactive modelEN / 中文
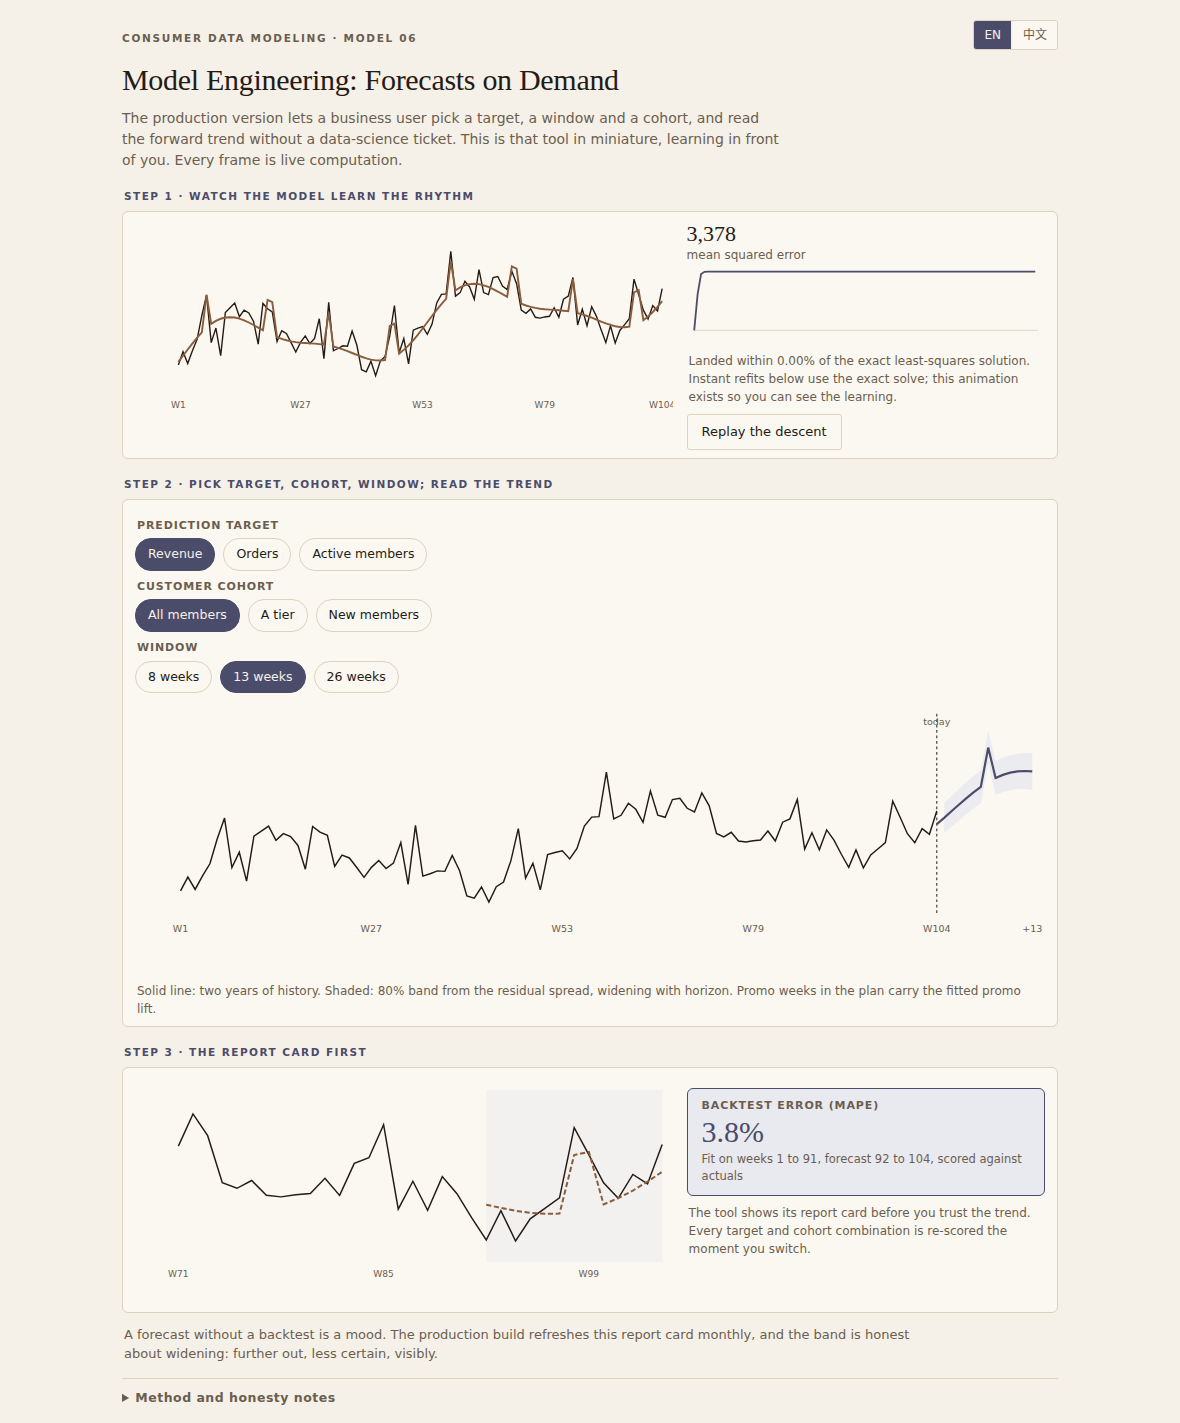
Forecast Tool preview
Forecast Tool

Pick target, cohort, window. The backtest report card comes first.

Interactive modelEN / 中文